Data prediction is no longer a fantasy reserved for the largest companies. Predictive analytics is indeed within everyone’s reach, now with SAP Analytics Cloud. The aim here is to present the specifics of the data prediction function available on SAC (For SAP Analytics Cloud). As you already know, this new analytical Cloud application integrates BI (Business Intelligence), PA (Predictive Analytics), and even Planning (Budget Creation) features. Today, the goal is to detail the use of the data projection function, also known by the charming name “Forecast.”
Prediction or Smart Discovery?
 SAP Analytics Cloud has several impressive features, including smart discovery…which is not quite prediction. Well, almost not. Be careful not to get confused.
Prediction
Prediction in the purest sense uses mathematical algorithms to predict a trend, a score, a projection of your data based on the provided history. More precisely, a forecast based on a time series runs an algorithm at the historical data level to predict future values for a specific measure within a planning model. SAP Analytics Cloud’s forecasting gives you an unbiased understanding of your company’s key influencers and lets you dive deeper into your data with interactive visuals. Note that this “Predictive” feature relies on ready-to-use R algorithms, but SAP Analytics Cloud also allows you to integrate your own R codes to go even further. We will return to this subject in detail later.
Smart Discovery
Smart Discovery is an IN-CRE-DIBLE option! In summary, this option allows you to discover hidden analytics around an indicator by clicking a button! Just like that. A smart discovery corresponds to the result generated by mapping your data to a statistical model to discover new or unknown relationships between columns in a data set. By choosing smart discovery, SAC offers a whole array of cross-analyses around the chosen indicator, allowing you to uncover important insights that you might not have identified when designing your dashboard. After executing a smart discovery, you can simulate numerical targets using the results of the key influencer analysis.
How Does Prediction Work?
To use predictive forecasts in SAP Analytics Cloud, download a dataset and ensure you have a sufficiently complete history so that the system can use it to predict over a longer period. Once you create a chart, you can apply forecasts. In the example below, we will show you the steps to configure predictive forecasts in SAP Analytics Cloud.
Start a Predictive Analysis
1. Select a chart on which you want to apply a predictive analysis and modify it from a trend chart to a time series chart. Note that you need to enhance dynamic hierarchies to show different levels of granularity. 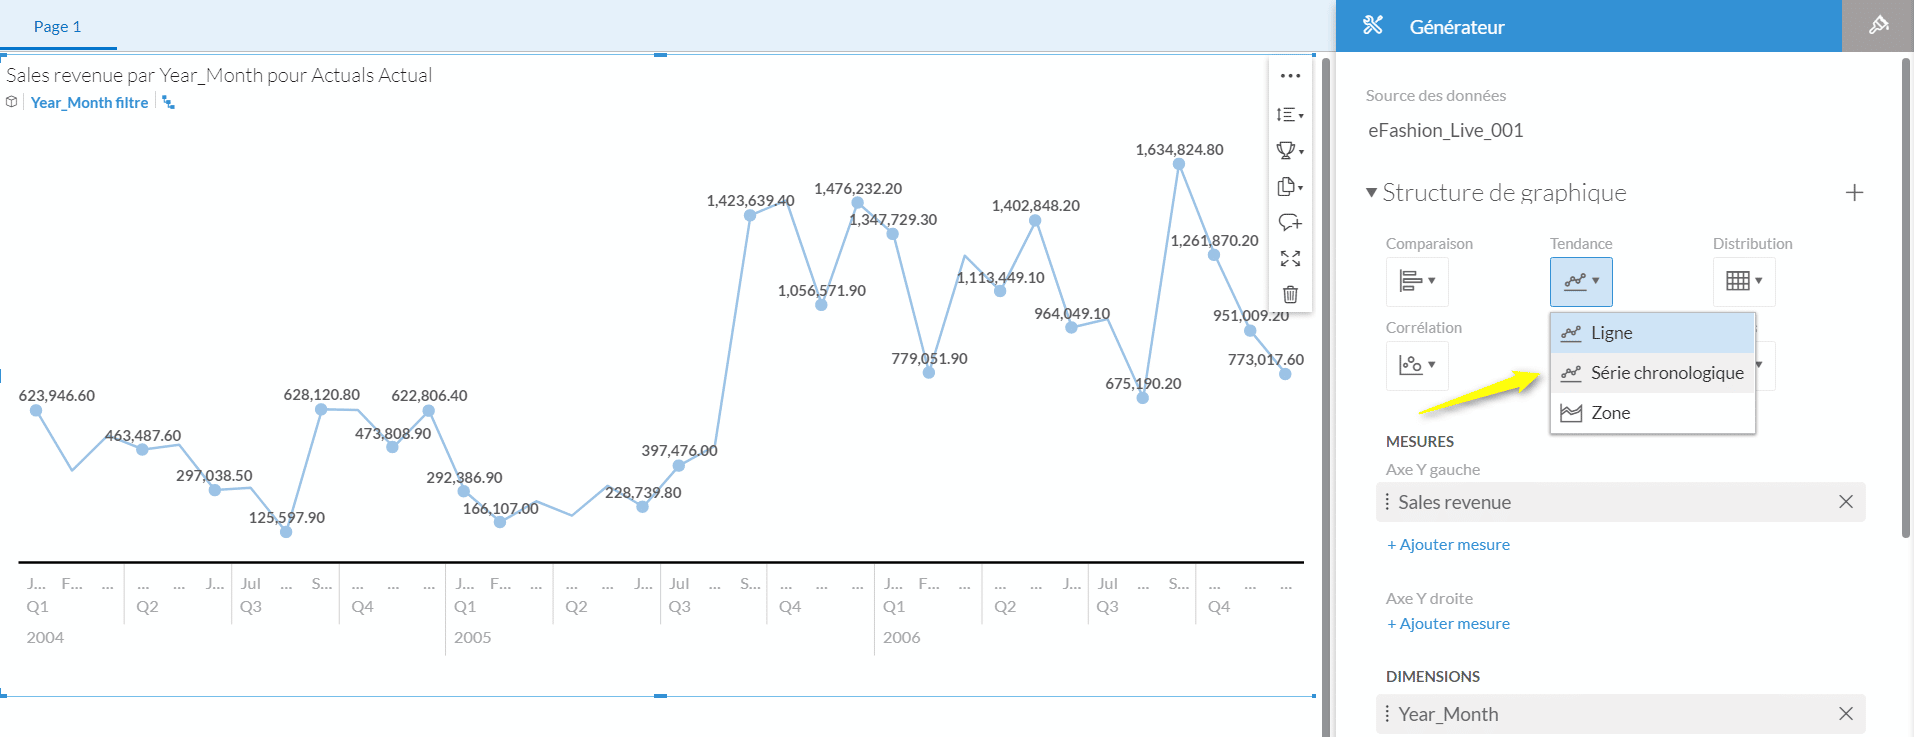 2. Select the last data point to add a forecast. You can choose the desired number of forecast periods. The maximum number you can predict is determined by the amount of historical data you have. You can also choose up to 3 dimensions per chart.
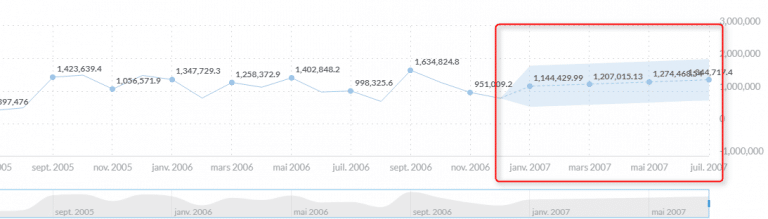
 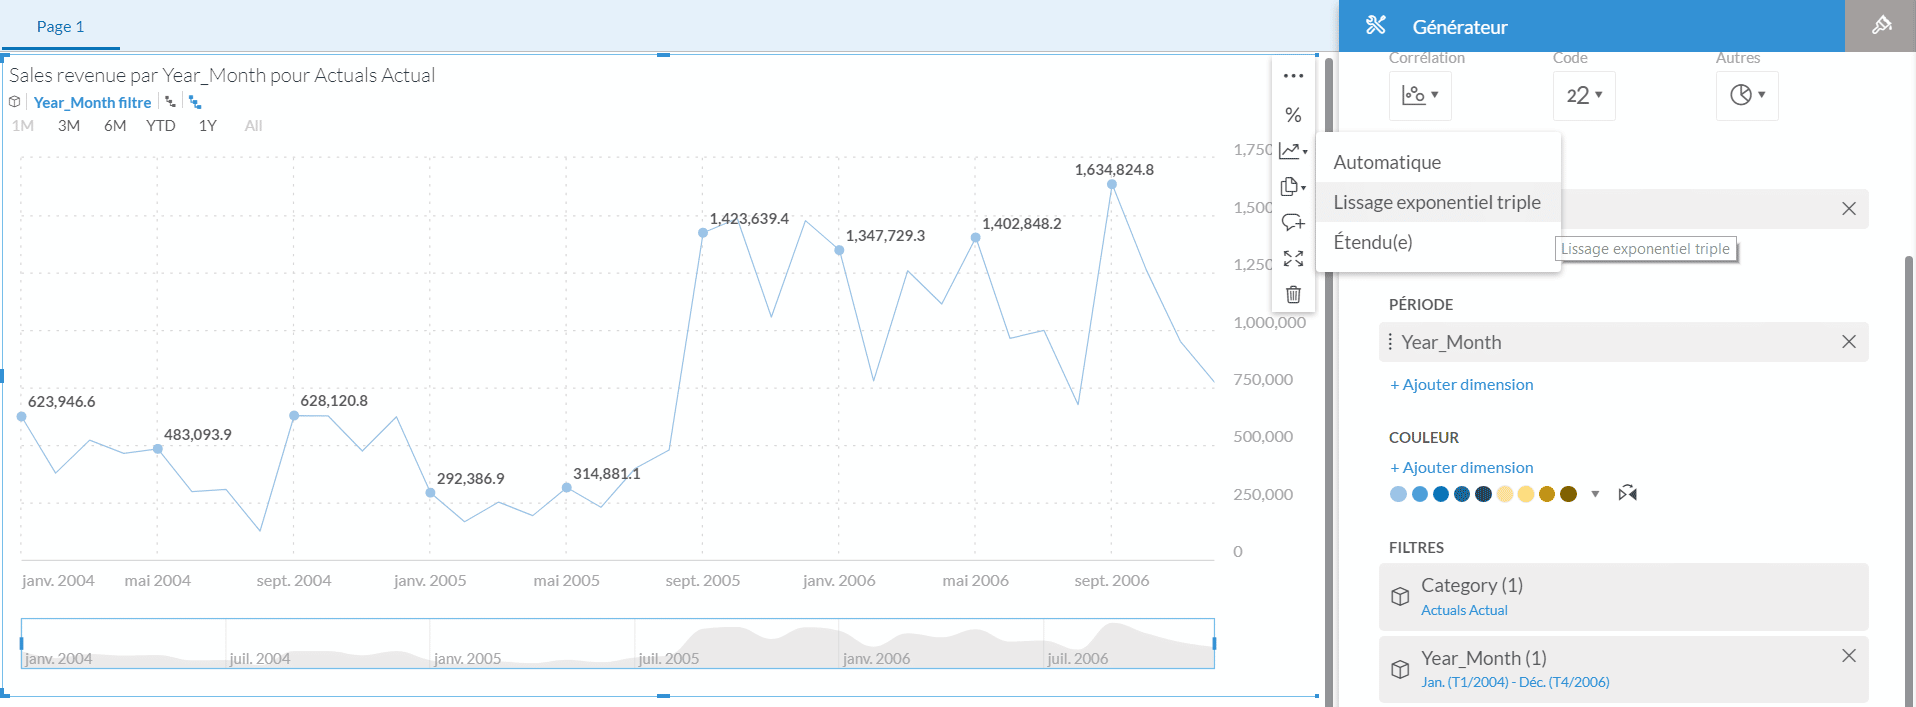 3. The forecast has been added and is indicated by a blue highlight and a dotted line. When you select a data point, you can see the upper and lower confidence limits (i.e., a probability of accuracy in the prediction). You can also edit the forecast if you want to change the color or add another variable.
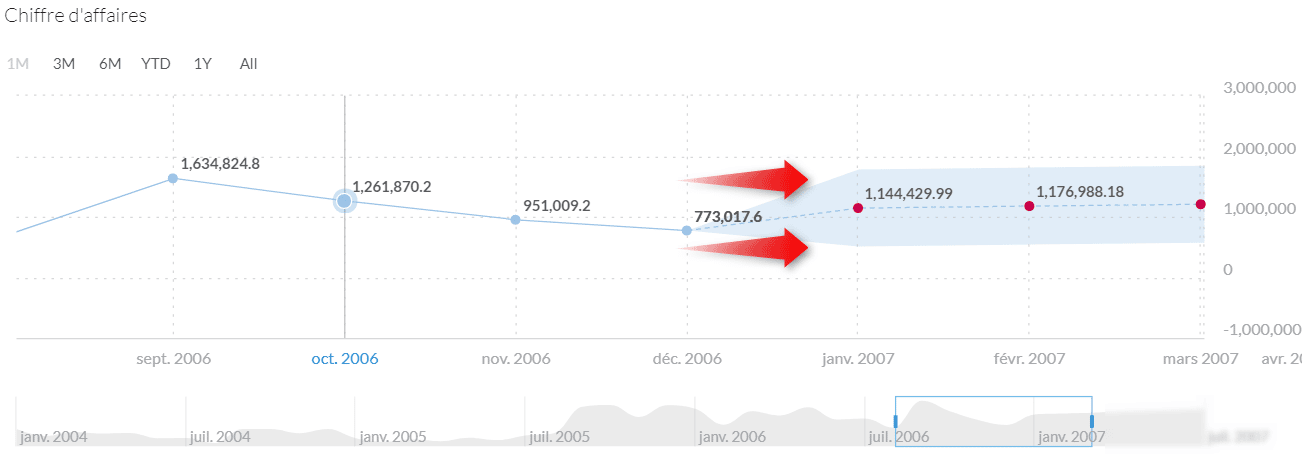
History as the Basis for Relevance
Moreover, to have a relevant analysis, it’s necessary to follow certain rules on how the algorithm works:
- It’s mandatory to have a minimum of 3 data points for the tool to make a prediction
- The operation is the same for any level of granularity (Year – Quarter – Month – Day)
This operation is cyclical; every additional 4 data points, the machine allows you to predict a new one. Thus, if you have a data history over 36 months, which corresponds to the machine as 36 points “January 2004 to December 2006,” it will allow you to make a prediction until “July 2007.”
- Discover the key influencers of your KPIs such as revenue, burn rate, and productivity
- Explore interactive charts and graphs, automatically generated based on your query
- Create predictive forecasts to predict future outcomes based on historical data
SAP BI 2025: The Next Generation of BusinessObjects
Since the publication of this article, SAP has continued to innovate with the launch of SAP BI 2025, available since March 12th. This new version marks a significant evolution compared to previous ones, with a particular focus on user experience and the creation of modern dashboards in Web Intelligence.
Among the major new features, we find:
- An enhanced BI Launchpad with improved performance, allowing you to pin KPIs directly on the homepage
- New interactive elements in Web Intelligence to create modern dashboards
- An innovative export format that allows users to interact with exported documents in a browser without consuming BO licenses
- Simplified workflows offering significant click savings
- An optimized BI platform with simplified migration and update processes
To deepen your knowledge of SAP BI 2025, we invite you to visit our detailed article on the JapprendslaBI site, our platform dedicated to BI & Data skill development. You will regularly find new tutorials, especially on this latest BI 2025 version.
In addition to this major evolution, SAP Analytics Cloud continues to establish itself as the reference cloud decision-making solution with its latest innovations:
- The integration of generative AI via SAP Analytics Cloud Copilot, which allows interacting with your data in natural language
- Even more powerful predictive capabilities, now integrating advanced machine learning models
- A completely redesigned mobile experience for access to analyses anywhere and anytime
- Optimized collaborative planning workflows for budget and forecast cycles
- Enhanced security meeting the strictest data protection requirements
SAP’s hybrid strategy allows today for a seamless combination of SAP BI 2025 and SAP Analytics Cloud, offering a gradual transition to the cloud while preserving your existing investments.
We have also organized a webinar dedicated to the new features of SAP BI 2025, including a live demonstration of the tool. This session will allow you to discover how these developments can considerably enhance your daily use of BusinessObjects, with more intuitive interfaces, increased performance, and new possibilities for visualization and interaction with your data.

Feel free to contact us to assist you in your transition to SAP BI 2025 and fully benefit from these new features!